Theoretical effect of countries’ population age distribution and social contact pattern on an uncontrolled Covid19 epidemic
Nicolas Moiroux (MIVEGEC, Univ. Montpellier, CNRS, IRD)
Paul Taconet (MIVEGEC, Univ. Montpellier, CNRS, IRD)
30 March 2020, updated on 06 October 2026
This work is for an academic and research purpose and should not
constitute a decision making support. We used a model that is simple in
its structure and its assumptions. The results do not necessarily
reflect the reality. Its purpose is to illustrate how social structure
and age distribution might affect the dynamic and public health
consequences of an outbreak. The codes and analyses used for this work
are available on github.
Introduction
“assessing the effectiveness of interventions that specifically
target social networks, such as school closure [or lock-down], requires
models that explicitly account for such social structure” (Prem
et al. 2017).
The objective of the present work was to investigate, in absence of any
intervention, how much country-specific age distribution and social
contact pattern affect the basic reproduction number (\(R_{0}\)) and the expected spread of the
COVID-19 disease. Using an age-structured SIR model fed with age
distribution data and contact matrices, we predicted and mapped \(R_{0}\) for 147 countries. We also present
the dynamic of the outbreak and age distribution of hospitalization, as
predicted by the model, for four selected countries.
Methods
The SIR model
We used an age-structured SIR model with 16 age classes (0-4; 5-9;
10-14; … 75+). It allow to explicitly account for the social structure
of the studied population. \[\begin{align}
\frac{dS_{i}}{dt} = -\beta S_{i} \sum_{j} C_{ij} I_{j}/N_{i}
\end{align}\] \[\begin{align}
\frac{dI_{i}}{dt} = \beta S_{i} \sum_{j} C_{ij} I_{j}/N_{i} - \gamma
I_{i}
\end{align}\] \[\begin{align}
\frac{dR_{i}}{dt} = \gamma I_{i}
\end{align}\]
Where \(\beta\) is the probability
of transmission on contact, \(i\) and
\(j\) are indices for age classes,
\(\gamma\) is the recovery rate. \(C\) is the contact matrix. \(N_{j}\) is the population in age \(j\).
Data
Contact matrices for 152 countries were obtained from the work of Prem et
al. (2017).
Data of age structure were obtained from the Health Nutrition and
Population (HNP) database available on the World Bank website.
Age stratified estimates of infection severity were taken from the
article of Verity et al. (2020).
Model parameters
From an estimated \(R_{0}\) of 2.5
for France (ETE
modelling team, 2020), we estimated parameter \(\beta\) (probability of transmission on
contact) using the following equality (Towers et al. 2012):
\[\begin{align}
\beta = \frac{R_{0}}{\gamma}\lambda
\end{align}\] Where \(\lambda\) is the largest eigenvalue of the
matrix \(M\) such as \(M_{ij} = C_{ij}f_{i}/f{j}\) with \(f_{i}\) and \(f_{j}\) are frequencies in the population
of age classes \(i\) and \(j\), respectively. Parameter \(\gamma\) (recovery rate) was set to \(\frac{1}{14}\) days\(^{-1}\).
Analyses
All analyses were performed using the software R. The script for the
model was adapted from here
to be used with more than 2 age classes.
We calculated \(R_{0}\) for countries
having both contact matrix and age structure data available using the
value of \(\beta\) calculated with
France data (see Model Parameter paragraph). Predicted \(R_{0}\) for 147 countries were mapped using
additional R packages sf and plotly.
We simulated the dynamic of the outbreak (prevalence of infection and
prevalence of immunization in the population) for 4 selected countries:
France, Germany, China and Niger. For this task, we introduced in the
model an infected individual in the 40-44 age group.
We used age stratified proportion of severe infections to predict the
age distribution of severe cases.
Data and codes are available online at GitHub.
Results
Predicting and mapping \(R_{0}\) worldwide
Probability \(\beta\) of
transmission on contact based on an estimated \(R_{0}\) of 2.5 in France was estimated to
be 0.0254205. Using this value of \(\beta\), we were able to predict \(R_{0}\) in 147 countries (Figure 1) for which both contact matrices and age structure
data were available.
Figure 1: Map of predicted \(R_{0}\) for 147 countries in absence of intervention according to an age-structured SIR model.
Countries differ only for age distribution of their population
and for social contact patterns. Other parameters (\(\beta\) and \(\gamma\)) being equals.These
\(R_{0}\) values are prediction of a
model, they are not real data
Predicted \(R_{0}\) ranged from 1.52
in Germany to 5.65 in Niger. Higher values of \(R_{0}\) were found to be in the
inter-tropical region.
Age distribution and contact characteristics of four selected countries
We selected four countries: Niger (highest predicted \(R_{0}\)), France, China and Germany (lowest
predicted \(R_{0}\)). Age distribution
and contact matrix for each of these countries are presented in Figure
2.
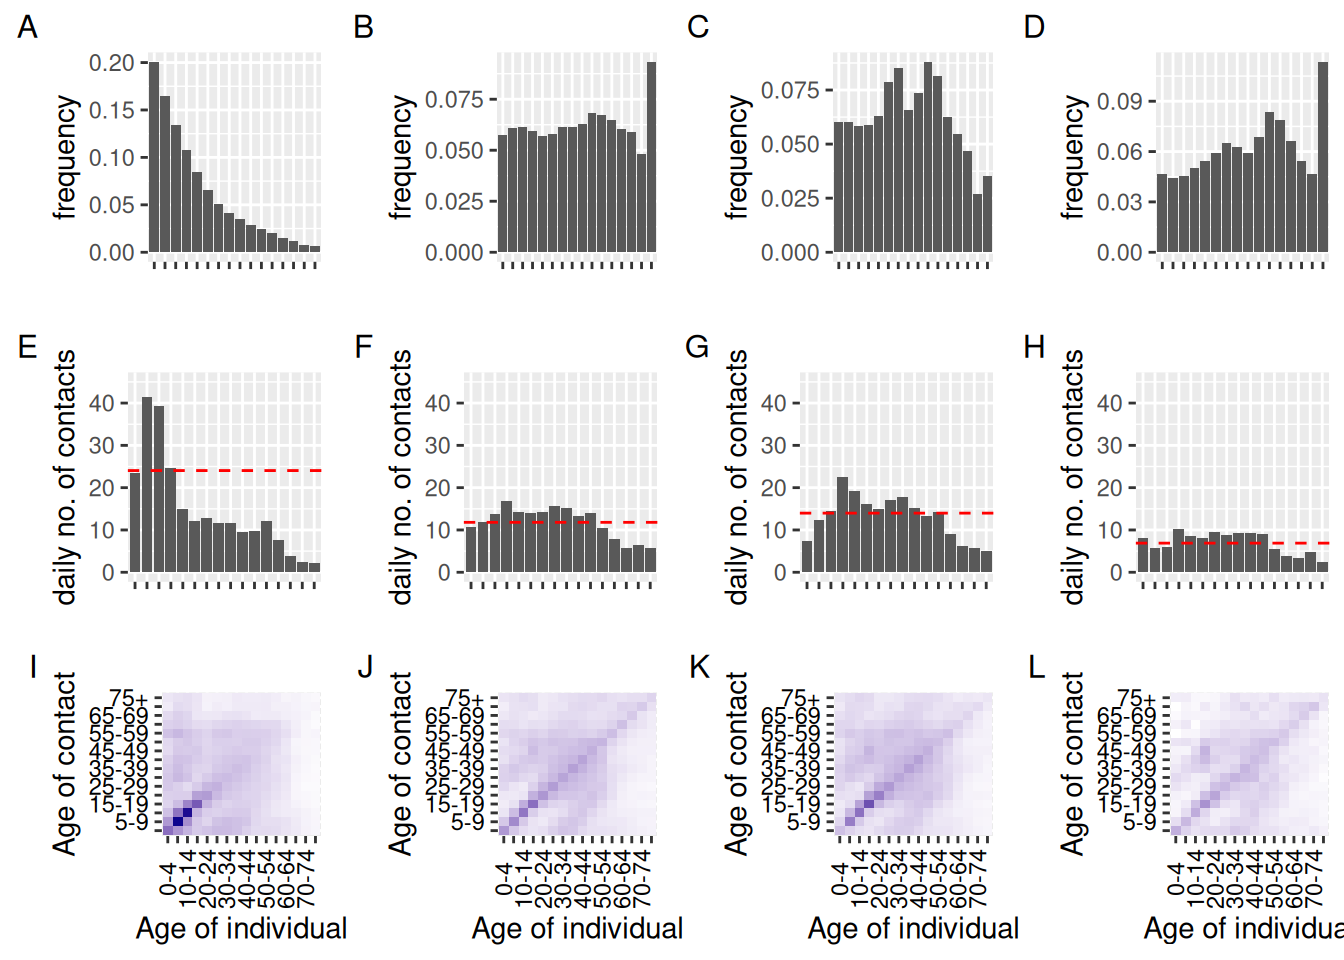
Figure 2: Age distribution, daily number of contacts and contact matrices for Niger (A, E, I), France (B, F, J), China (C, G, K) and Germany (D, H, L).
Horizontal red dashed lines indicate the mean number of daily
contacts per individuals. For contact matrix plots, darker color
intensities indicate more contacts. Data from here and here.
Age distribution of Niger is typical of countries with high birth rate
and low life expectancy, the size of each cohort is larger than that of
older cohorts. In average, individuals in Niger experience 24 c.d\(^{-1}\) (contacts per days). These contacts
occur mostly between individuals of < 20 years old (that represent
more than 60% of the total population).
Age distribution of France is almost stationary with a somewhat equal
proportion of the population in each age group. The mean number of daily
contact is 11.8 c.d\(^{-1}\) mostly
with individual of the same age. There is little differences of daily
number of contacts among age classes.
Age distributions of China and Germany are constrictive with lower
percentage of younger people. The mean number of daily contact in China
was 14 c.d\(^{-1}\), closed to what is
observed in France but with more differences between age classes.
Individuals in Germany experience the lowest number of daily contact
with a mean of 6.9 c.d\(^{-1}\).
Outbreak simulation for Niger, France, China and Germany
We then simulated the outbreak in these four countries (Niger, France, China and Germany) using the SIR model. Predicted \(R_{0}\) for these countries were as follow:
## Niger R0 = 5.649338
## France R0 = 2.499001
## China R0 = 2.978447
## Germany R0 = 1.514464
Reminder: \(R_{0}\) of France
was not predicted but estimated here
and we used this value to estimate probability \(\beta\) of transmission on contact that was
used, in turn, to estimate \(R_{0}\) of
other countries (see Methods section).
Here, we see that the higher is the mean number of contact per
individuals, the higher is \(R_{0}\).
Higher \(R_{0}\) is expected to induce
faster outbreaks and a higher proportion of infected (and then
immunized) individuals (Figure 3 and 4).
Figure 3: Prevalence of infection predicted by an age-structured SIR model fed with population data of Niger, France, China and Germany for an uncontrolled Covid19 epidemic.
Figure 4: Prevalence of immunization predicted by an age-structured SIR model fed with population data of Niger, France, China and Germany for an uncontrolled Covid19 epidemic.
Total severe cases and their distribution by ages
We used estimates of infection severity (i.e. needing hospitalization) provided by Verity et al. (2020) to predict overall proportions of the population expected to need hospitalization due to Covid-19 and its age distribution (Figure 5).
The proportions of the population that were expected to need an
hospitalization were 1.3 %, 4.2 %, 3.8 % and 2.3 % in Niger, France,
China and Germany, respectively.
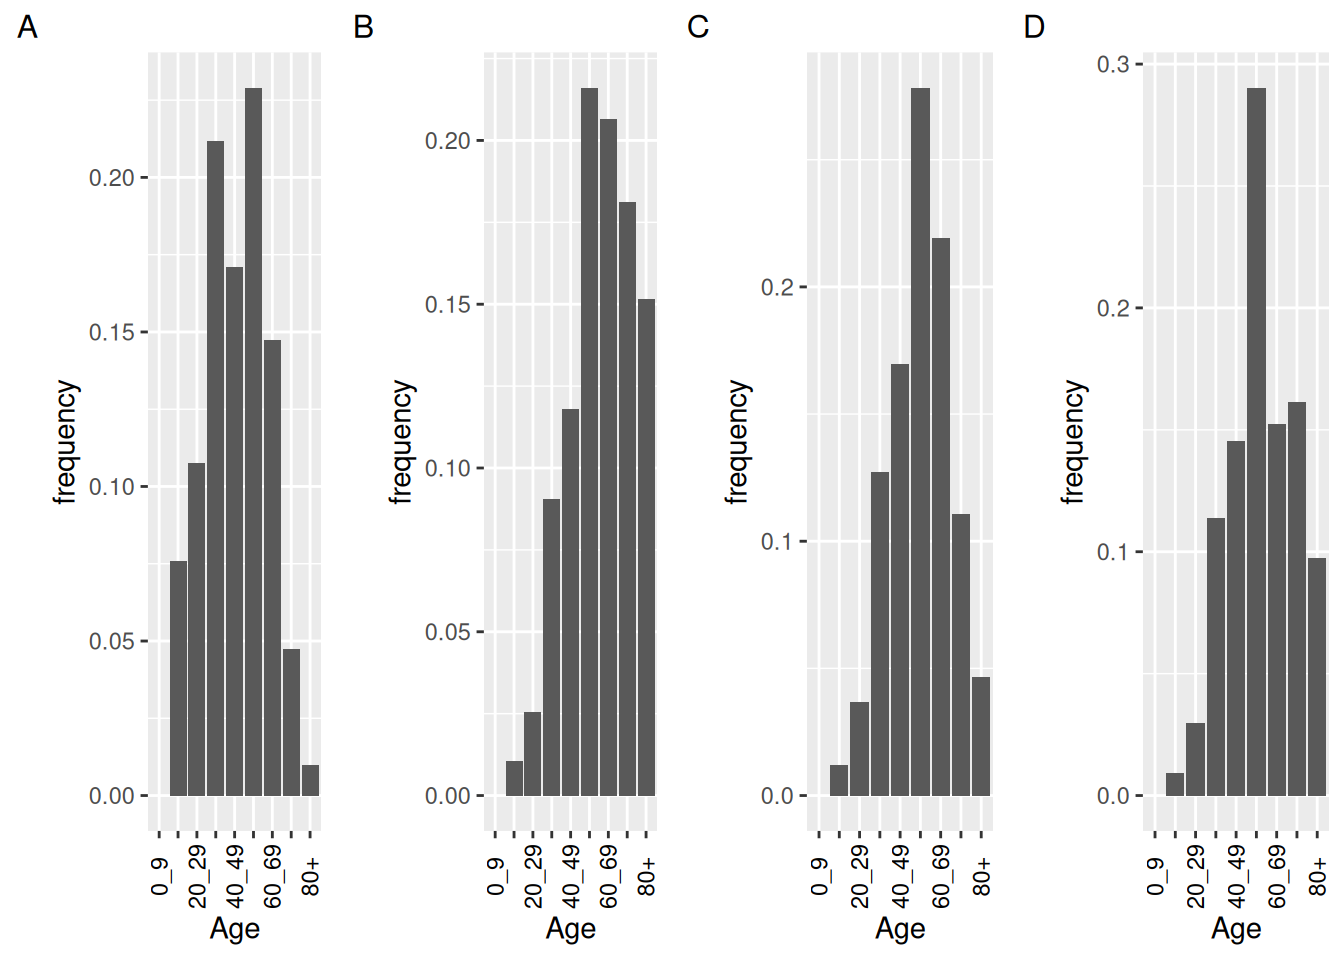
Figure 5: Expected age distribution of severe cases during an uncontrolled Covid19 outbreak for Niger (A), France (B), China (C) and Germany (D).
Despite a higher proportion of the population expected to be infected,
Niger was predicted to experience the lower number (in proportion) of
severe case among the four studied countries. However, the median age
for severe cases is expected to fall in the 40-50 age group whereas it
is expected to be in the 50-60 age group for Germany and China. In
France, the median age for severe cases is expected to fall in the 60-70
age group.
References
Prem K, Cook AR, Jit M. Projecting social contact matrices in 152
countries using contact surveys and demographic data. PLOS
Computational Biology. 12 sep 2017;13(9):e1005697.
Towers S, Feng Z. Social contact patterns and control strategies for
influenza in the elderly. Math Biosci. dec
2012;240(2):241‑9.
Verity R, Okell LC, Dorigatti I, Winskill P, Whittaker C, Imai N, et
al. Estimates of the severity of coronavirus disease 2019: a model-based
analysis. Lancet Infect Dis. 30 mar 2020.
ETE modelling team. Estimating the basic reproduction number of the
COVID-19 epidemic in France. http://alizon.ouvaton.org/Report1_R0_France.html. 14 mar
2020.
References of R packages used in this work
Soetaert K, Petzoldt T, Setzer RW (2010). “Solving Differential
Equations in R: Package deSolve.” Journal of Statistical
Software, 33(9), 1-25. ISSN 1548-7660, http://doi.org/10.18637/jss.v033.i09).
Grolemund G, Wickham H (2011). “Dates and Times Made Easy with
lubridate.” Journal of Statistical Software, 40(3), 1-25. http://www.jstatsoft.org/v40/i03/
Wickham H, Averick M, Bryan J, Chang W, McGowan LD, François R,
Grolemund G, Hayes A, Henry L, Hester J, Kuhn M, Pedersen TL, Miller E,
Bache SM, Müller K, Ooms J, Robinson D, Seidel DP, Spinu V, Takahashi K,
Vaughan D, Wilke C, Woo K, Yutani H (2019). “Welcome to the tidyverse.”
Journal of Open Source Software, 4(43), 1686. http://doi.org/10.21105/joss.01686.
Wickham H, Bryan J (2019). readxl: Read Excel Files. R package version
1.3.1, https://CRAN.R-project.org/package=readxl.
Tennekes M (2018). “tmap: Thematic Maps in R.” Journal of
Statistical Software, 84(6), 1-39. http://doi.org/10.18637/jss.v084.i06.
Pebesma E (2018). “Simple Features for R: Standardized Support for
Spatial Vector Data.” The R Journal, 10(1), 439-446. http://doi.org/10.32614/RJ-2018-009.
Sievert C (2018). plotly for R. https://plotly-r.com.
Graumann J, Cotton R (2018). “multipanelfigure: Simple Assembly of
Multiple Plots and Images into a Compound Figure.” Journal of
Statistical Software, 84(3), 1-10. http://doi.org/10.18637/jss.v084.c03.